Every biologist needs a book to read in the life of its favoured organism. For ichthyologists, teleost scales have been telling stories over a century. Because of their external position, they are easy to remove. Among other applications, they give access to life history traits, such as age (at maturity or at migration) and growth (Figure 1). By delineating annuli (yearly rings deposited during winter) and measuring the associated interannuli spacing, one can estimate an individual’s growth trajectory and migratory status (Elliott and Chambers, 1996); however, measurements may vary across readers and scales, for a same fish.

Figure 1: Scale of a sea trout reflecting its life history traits.
Over time, researcher have come to the acceptance that multiple readings (numerous scales or numerous readers) are better to gain reliable information (Panfili et al., 2002). However, the number of scales or readers required to determine life history traits is not that easy to define because first, it depends on the fish species and second, the mention of the required methodology for one species is rarely explicit in the literature. Over the past 30 years, the number of validation studies has increased (Campana, 2001), yet the number of required readings to capture biological variability is still unclear. When is it required to proceed to multiple readings? Which variable needs multiple readings (age, growth)? Should we read several scales, or have several readers, or both ?
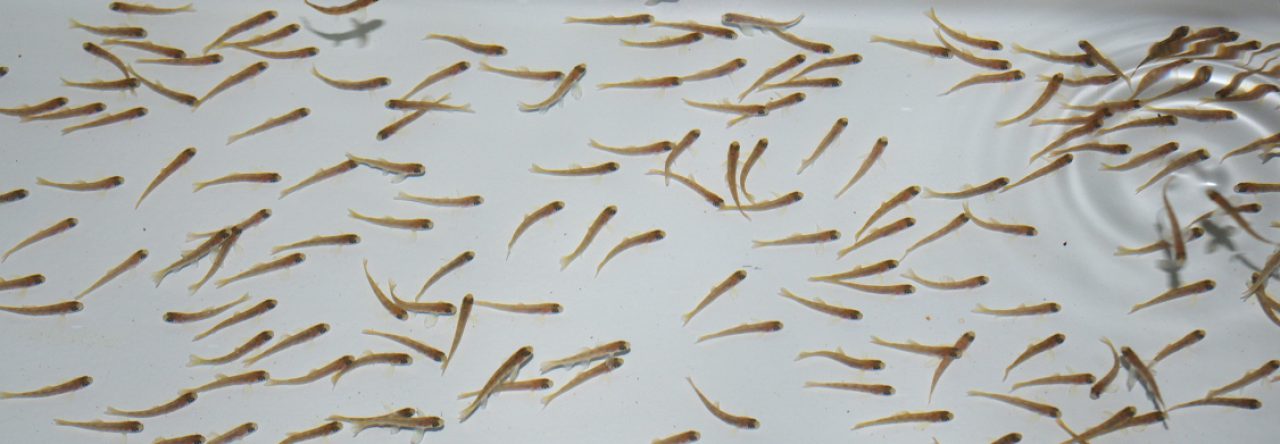
Individual variation has become a foremost concern in biology, it is therefore paramount to come up with sampling designs able to minimize sampling effort while keeping information level steady: indeed, a reasonable shortcut to avoid redundancy and a waste of resources. Following that idea, Lucie Aulus and colleagues sampled scales of 60 fish originating from the Kerguelen Is. (one of our beloved destinations). For each fish, they determined total age at capture by counting annuli (TA) and measured the total radius (TR) on 4 different scales, using two different readers in a double blind manner (Figure 2).

They then decomposed data variance hierarchically in a nested and crossed manner, namely Fish–Reader–Scale to determine which levels account for the variance in growth and age (Figure 2). The reliability of both scale total radius and fish age was estimated by the r repeatability coefficient (Stoffel et al., 2017). This coefficient ranges from 0 to 1, a high value indicating that a similar result is more likely to be observed when repeating the observation (or measure) under consistent conditions.
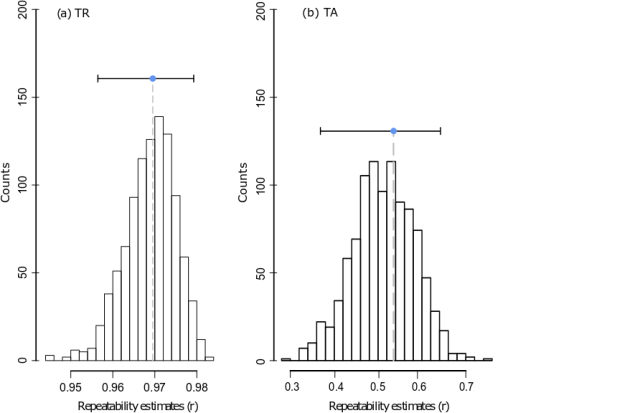
Figure 3: Repeatability estimates (r) of (a) total radius (TR) and (b) total age (TA). Symbols and dashed lines indicate the median of the repeatability estimates (r) of Fish level, with uncertainty (i.e. 95% confidence intervals) indicated, obtained over 1000 bootstraps.
For scale total radius (TR), the repeatability was extremely high (97%, Figure. 3a), meaning that whatever the reader or the scale, the measure of total radius was very stable. Basically, it means that when sampled in a relatively well located area on the fish, total radius would be well estimated by using a single measure on a single scale by a single reader. On the contrary, for total age (TA) the repeatability was about 53% (Fig. 3b). Readers indeed sometimes disagreed in delineating annuli on a same scale, or different scales from a same fish provided different age readings consistent between readers.
So, two variables, but not the same repeatability, and yet, these two variables are often associated in various analyses, for instance, to build growth models. The present case study thus indicates that if age is a relative problem, total radius is not, and therefore total radius might not need to be sampled on every scale samples (avoid redundancy, right?). Second, by estimating repeatability, we also estimate the different sources of errors: these error estimates can be later reinjected into further models for total age, wherein we would read less scales per fish, allowing us to increase the number of fish studied for the same effort (to prevent wasting resource).
As soon as one envisions important amounts of scale analysis, such preliminary investigations to quantify errors should be a prerequisite: it can provide valuable insights for accurate modelling of individual variability. Such understanding of interindividual variability could have several applications in stock assessment and conservation. It could also save significant amount of resources for retrospective studies, for which scales collections are invaluable assets.
More details on our study here:
Cited literature:
Campana, S.E., 2001. Accuracy, precision and quality control in age determination, including a review of the use and abuse of age validation methods. J. Fish Biol. 59, 197–242. https://doi.org/10.1111/j.1095-8649.2001.tb00127.x
Elliott, J., Chambers, S., 1996. A guide to the interpretation of sea trout scales., R & D Report. National Rivers Authority, Bristol (UK).
Panfili, J., De Pontual, H., Troadec, H., Wright, P.-J., 2002. Manuel de sclérochronologie des poissons, Editions Quae. ed. IFREMER : IRD, Plouzané, Paris ; France.
Stoffel, M.A., Nakagawa, S., Schielzeth, H., 2017. rptR: repeatability estimation and variance decomposition by generalized linear mixed-effects models. Methods Ecol. Evol. 8, 1639–1644. https://doi.org/10.1111/2041-210X.12797
